Power Amplifiers
The Need to Amplify Signals
An amplifier is one of the most common electrical elements in any system. The requirements for amplification are as varied as the systems where they are used. Amplifiers are available in a large number of form factors ranging from miniscule ICs to the largest high-power transmitter amplifiers. In the following discussion the focus will be on solid state power amplifiers used at microwave frequencies, particularly in test and measurement applications.
Microwave power amplifiers may be used for applications ranging from testing passive elements, such as antennas, to active devices such as limiter diodes or MMIC based power amplifiers. Furthermore, other applications include testing requirements where a relatively large amount of RF power is necessary for overcoming system losses to a radiating element, such as may be found at a compact range, or where there is a system requirement to radiate a device-under-test (DUT) with an intense electromagnetic field, as may be found in EMI/EMC applications.
As varied as the system requirements may be, the specific requirements of a given amplifier can also vary considerably. Nevertheless, there are common requirements for nearly all amplifiers, including frequency range, gain/gain flatness, power output, linearity, noise figure/noise power, matching, and stability. Often there are design trade-offs required to optimize any one parameter over another, and performance compromises are usually necessary for an amplifier that may be used in a general purpose testing application.
Followings are some key technical tools: Key Amplifier Terms | Voltage vs Power in 50 ohm | Power Conversion | Power Loss vs VSWR | Advantage of amplifier near DUT | Microwave Power Amplifier Selection Guide
|
Key Amplifier Terms |
|
|
Frequency Range |
The frequency range over which the amplifier is specified to operate
|
|
Output Power Level |
Psat = saturated output power level = the maximum power available from the amplifier
P1dB = output power level at which the gain has decreased 1 dB from its small signal value
P3dB = output power level at which the gain has decreased 3 dB from its small signal value
|
|
Gain |
Gain = the small signal gain of the amplifier when operating in the linear region well below saturation
|
|
Gain Flatness |
Gain flatness = the variation in small signal gain across the amplifier’s frequency range
|
|
VSWR |
Input VSWR = The deviation from an ideal impedance match with the amplifier’s input port
Output VSWR = The deviation from an ideal impedance match with the amplifier’s output port
|
|
Noise Figure |
Noise Figure (NF) = a measure of added noise from the amplifier (in dB) = the ratio of output noise to that noise which would be present if the amplifier itself did not introduce any noise
|
|
Noise Factor |
Noise Factor (F) equals the ratio of the signal-to-noise at the input over the signal to noise at the output. The Noise Figure (NF) = 10 log10 (F) |
|
Harmonics |
As an amplifier approaches saturation, harmonics (multiples) of the input signal are generated.
Amplifiers with sharp saturation knees will produce lower harmonics up to saturation.
|
|
Intermodulation |
No amplifier is perfectly linear. When two or more signals are amplified, intermodulation frequencies are generated. For frequencies F1 and F2, intermodulation products are at F1 ± F2, 2 F1, 2 F2, 2(± F1 ± F2).
|
|
Stability |
Spanawave/Giga-tronics’ Instrumentation Amplifiers are unconditionally stable, however, it is a best practice to always power off amplifiers when not connected to a load.
|
back to top
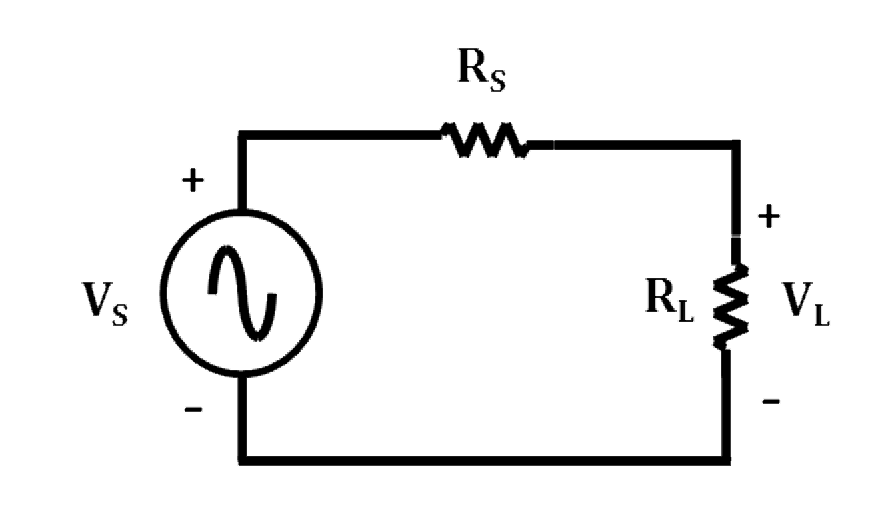 |
Voltage vs Power in 50 ohms |
|
Vrms |
dBm |
Watts |
|
70.7 |
50 |
100 |
|
22.4 |
40 |
10 |
|
7.07 |
30 |
1 |
|
2.24 |
20 |
100 mW |
|
0.707 |
10 |
10 mW |
|
0.224 |
0 |
1 mW |
back to top
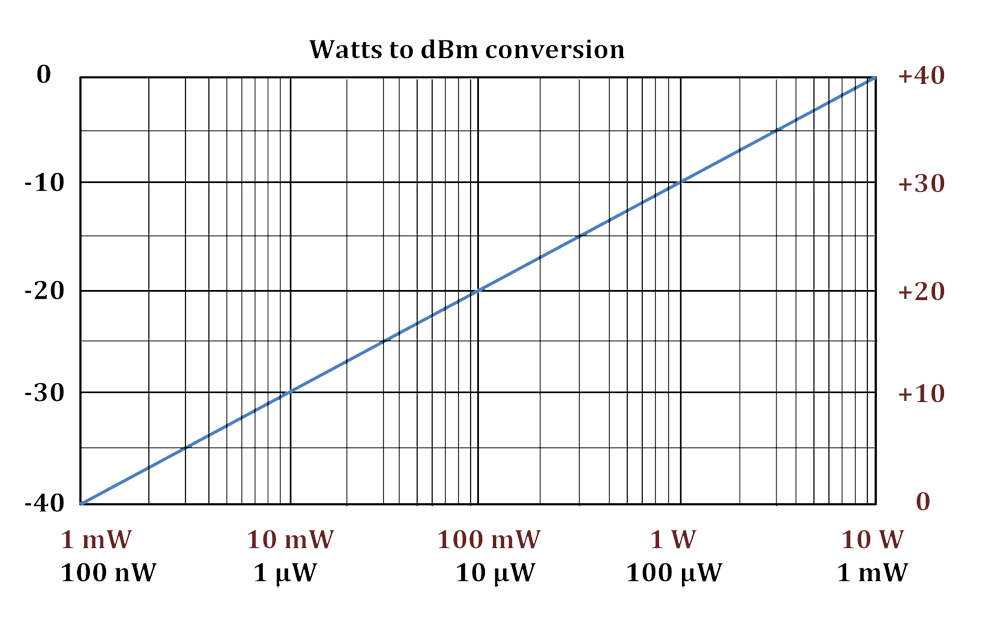
Power Conversion
|
dBm |
Watt |
|
Watt |
dBm |
|
30 |
1 |
|
1000 |
60 |
|
27 |
500 mW |
|
100 |
50 |
|
23 |
300 mW |
|
10 |
40 |
|
20 |
100 mW |
|
1 |
30 |
|
17 |
50 mW |
|
100 mW |
20 |
|
13 |
20 mW |
|
10 mW |
10 |
|
10 |
10 mW |
|
1 mW |
0 |
|
7 |
5 mW |
|
0.1 mW |
-10 |
|
3 |
2 mW |
|
0.01 mW |
-20 |
|
0 |
1 mW |
|
0.001 mW |
-30 |
back to top
Power Loss, Trasmitted % and Voltage Refl. Coeff vs VSWR and Return Loss
|
VSWR |
RL (dB) |
Loss (dB) |
Trans. (%) |
Đ“ |
|
1.1 |
26.4 |
0.01 |
99.8 |
0.05 |
|
1.2 |
20.8 |
0.036 |
99.2 |
0.09 |
|
1.3 |
17.7 |
0.075 |
98.3 |
0.13 |
|
1.4 |
15.6 |
0.122 |
97.2 |
0.17 |
|
1.5 |
14 |
0.177 |
96 |
0.20 |
|
1.6 |
12.7 |
0.238 |
94.7 |
0.23 |
|
1.7 |
11.7 |
0.302 |
93.3 |
0.26 |
|
1.8 |
10.9 |
0.37 |
91.8 |
0.29 |
|
1.9 |
10.2 |
0.44 |
90.4 |
0.31 |
|
2 |
9.5 |
0.51 |
89 |
0.33 |
|
2.5 |
7.4 |
0.88 |
82 |
0.43 |
|
3 |
6 |
1.25 |
75 |
0.50 |
|
4 |
4.4 |
1.94 |
64 |
0.60 |
|
5 |
3.5 |
2.55 |
55 |
0.67 |

back to top
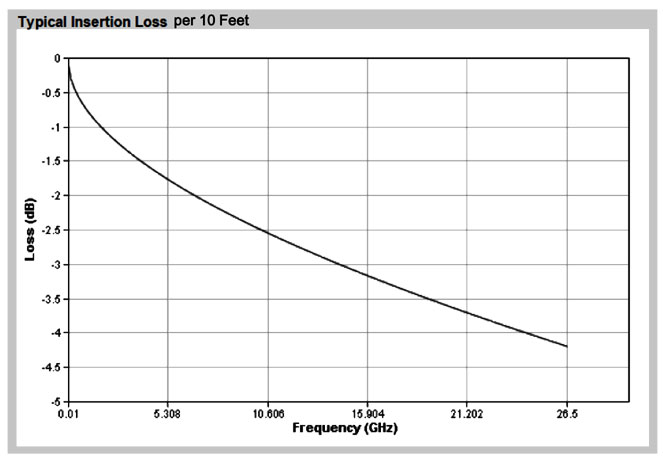
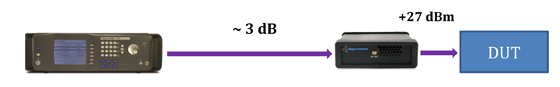
Advantage of amplifier near DUT
|
The best quality low-loss microwave cable is about 0.35 dB/ft at 20 GHz and 1 dB/ft at 40 GHz |
 |
 |
|
With 3 feet of cable at 40 GHz, half the power lost in the cable but full power at the DUT |
back to top
|
